Gold Maps reveal nationwide geological patterns that help explain where gold occurs across the United States.
Gold Maps
Mining history, geology, and modern mapping—brought together so then you can see where gold occurs and why it shows up there.
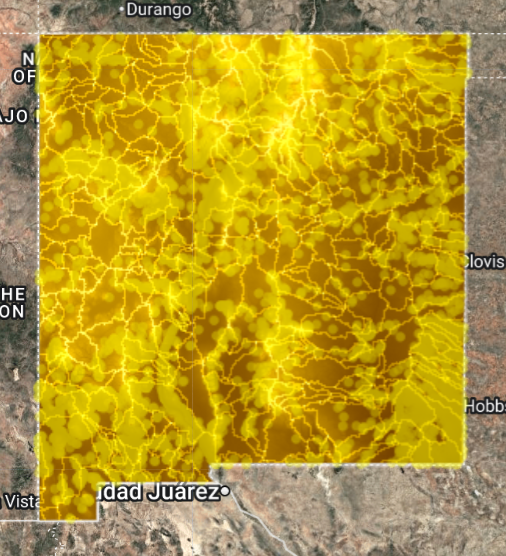
Example of a Gold Map interpretation showing geological structure, terrain, and predicted gold probability patterns in New Mexico.
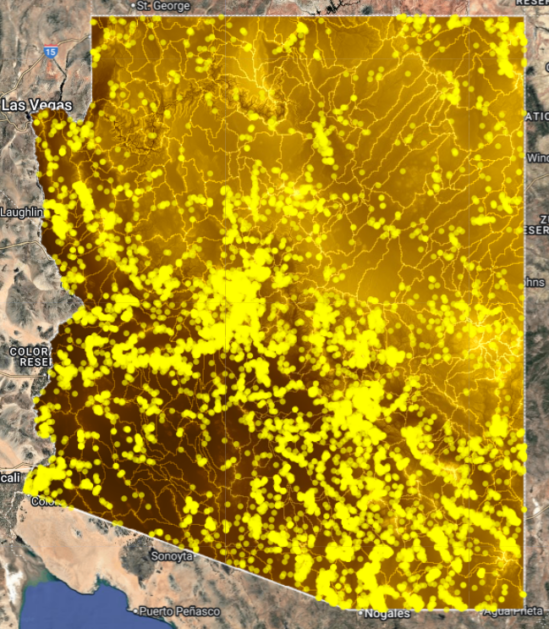
Gold maps are one of the fastest ways to understand gold at scale. As a result, instead of guessing, a well-built gold map helps visualize how geology, structure, and terrain work together over time. Consequently, patterns become easier to recognize and compare.
If you’ve ever wondered where to begin—or why gold appears in one area but not another then you’re already thinking in terms of spatial relationships. Therefore, learning how mapping works is the natural next step.
Start Here
From Data to Patterns
Raw data alone rarely tells the full story. However, when deposits, structures, and terrain are viewed together, relationships then begin to emerge. In other words, mapping turns scattered information into something you can interpret and test.
Why Context Matters
Gold rarely occurs at random. Instead, it follows structural trends, erosion pathways, and geological boundaries. Consequently, understanding context then helps you eliminate weak ground and focus attention where conditions consistently align.
What Gold Mapping Shows
What You’re Actually Looking At
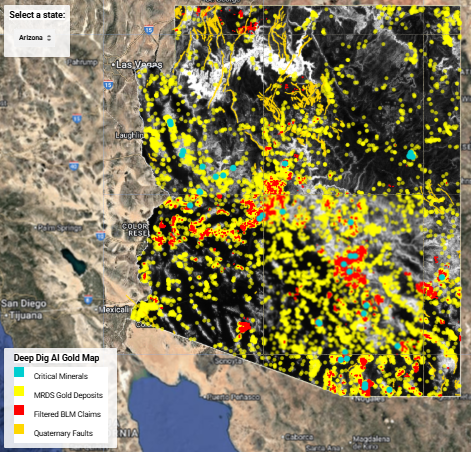
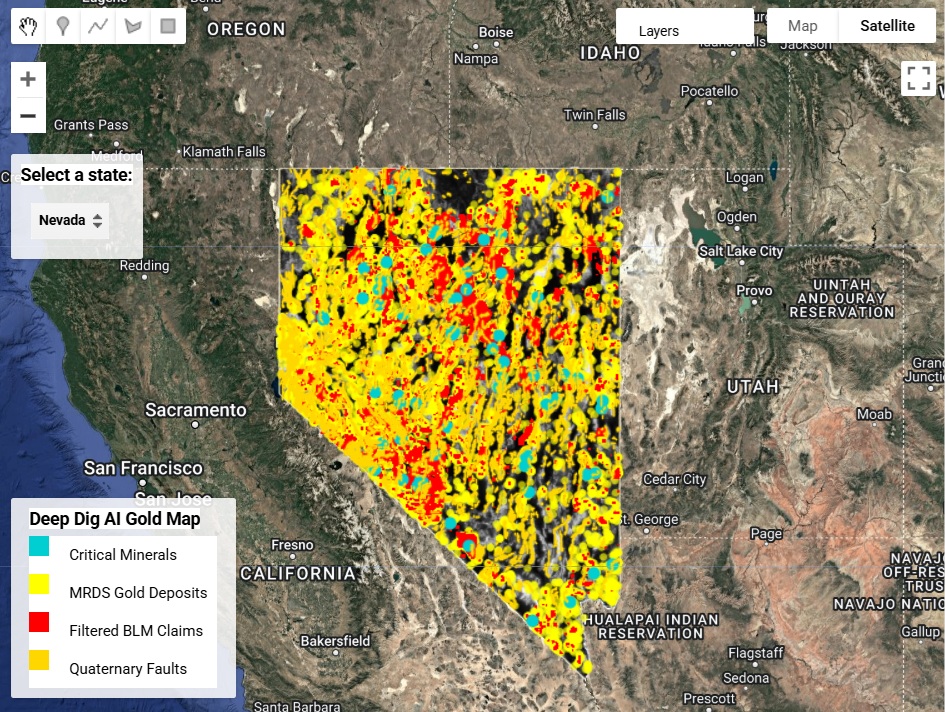
A gold map is a visual guide that helps you interpret where gold is known to occur and where conditions increase the probability of gold. Furthermore, these views combine evidence—historic deposits, structural trends, and regional geology—into a single place you can explore. As a result, you can move from “random searching” to “informed targeting.”
Four Signals That Matter Most
- Occurrence — where gold has been documented
- Structure — faults, shear zones, and controls that focus mineralization
- Terrain — erosion, basins, drainages, and where heavy minerals concentrate
- Context — why gold shows up in specific belts and districts
Why These Signals Repeat
In many regions, the same controls show up again and again. Therefore, once you learn a pattern in one district, then you can apply it elsewhere. Moreover, this repetition is exactly what turns mapping into a skill rather than a one-time lookup.
What Makes a Map Great
Clarity First
However, not all mapping is created equal. Some maps are just pin-drops, while others are cluttered with layers that don’t translate into decisions. Therefore, the best layouts prioritize clarity then you can choose ground confidently.
A Practical Decision Standard
If a layer does not change what you do next, remove it. Consequently, your view stays clean, and your decisions get faster. Additionally, you’ll spend more time verifying strong targets instead of managing clutter.
Context and Action
Clarity
Clean layers reduce noise. Consequently, you can focus on the strongest signals then plan faster.
Context
Good mapping explains why gold occurs. In addition, it helps you recognize systems instead of chasing dots.
Action
Ultimately, the goal is decisions. For example, you’ll know where to start, what to verify, and what to skip.
How to Use a Gold Map
A Simple Workflow
The goal is simple; therefore, start with a plan. First, narrow the state and region. Next, identify the strongest overlaps. Then, verify with real-world observation and sampling. Finally, repeat and refine. Over time, this process builds real confidence.
Step-by-Step
To keep it practical, use the steps below as a quick checklist. Moreover, revisit this workflow after each trip so your targeting improves.
- Choose a state where gold is historically proven
- Zoom into districts and look for consistent patterns
- Follow structure—faults and shear trends often control gold
- Check terrain—basins, drainages, and slope breaks concentrate material
- Plan a route—access, land status, and practical field time
What to Verify in the Field
Once you arrive, compare what you see to what the layers suggest. For example, check gravels, breaks in slope, contact zones, and structural lineaments. Meanwhile, take notes and photos so you can refine your plan afterward. As a result, each trip improves the next.
Tip: If you’re new, start with a proven state. Then, learn the patterns and apply them anywhere. As a result, your learning compounds quickly.
Plan Better Trips With Better Questions
Start With “Where Would Gold Travel?”
Instead of asking “Where is a dot on a map?”, ask “Where would gold move through this landscape?”. Consequently, you begin to think like a prospector who reads systems. Moreover, this shift helps you spot corridors, traps, and breaks that deserve a closer look.
Then Ask “What Would Concentrate It Here?”
Gold can be released from source rock and then concentrated in favorable terrain. Therefore, look for slope changes, inside bends, bedrock pinch points, and basin edges. In addition, compare multiple drainages so you can see which ones repeat the strongest signals.
Finally, Keep a Simple Field Log
Even a basic notebook improves results. For example, record the date, the coordinates, the material type, and your observations. Then, when you return home, compare your notes to what the layers suggested. As a result, you refine faster and waste less time.
Learn Faster With One State, Then Expand
Pick a Proven Starting Point
If you want the quickest learning curve, start with a well-known gold state. Therefore, you’ll see clearer districts and more consistent patterns. Additionally, you’ll have more real-world references to compare against, which speeds up your understanding.
Afterward, Transfer the Pattern
Once you can recognize a pattern in one region, apply it to another. Consequently, you stop relying on luck and begin relying on observation. Moreover, this approach works whether you’re chasing placers, investigating hardrock, or simply planning weekend scouting.
In the End, Consistency Wins
Consistent process beats occasional hype. Therefore, use the same workflow every time: review, plan, verify, and record. As a result, your “hit rate” improves steadily, even if conditions change.
Useful Links
Explore Our Tools
If you’re ready to explore, start with our state map collection. Additionally, if you want structured learning, you can join the Academy and follow the workflow step-by-step.
External References
For practical prospecting lessons, you can watch our videos on YouTube.
Historic example: Early gold maps recorded known mining districts and discoveries, forming the foundation for modern geological gold mapping.
The History of Gold Maps
From Hand-Drawn Records to Geological Insight
Historically, gold maps began as simple sketches created by miners and surveyors. Therefore, early maps focused almost entirely on known workings, placer strikes, and visible ore zones. However, these early records rarely explained why gold occurred in one location and not another.
As a result, prospecting relied heavily on luck and local knowledge. Consequently, many productive systems remained undiscovered for decades. In other words, gold maps existed, but understanding lagged behind discovery.
The Rise of Geological Mapping
Eventually, geological surveys transformed how gold maps were created. For example, government agencies began mapping rock types, faults, folds, and mineral belts. Therefore, gold locations could finally be viewed within a geological framework instead of isolation.
Moreover, these advances revealed that gold follows repeatable patterns. Consequently, districts with similar structures and terrain began producing similar results. As a result, gold maps evolved from static records into predictive tools.
Digital Mapping and Data Integration
With the rise of computers, gold maps entered a new era. Specifically, digital elevation models, satellite imagery, and mineral databases became widely available. Therefore, prospectors could analyze entire regions instead of isolated claims.
In addition, layered mapping made relationships easier to see. For instance, faults could be compared directly against drainages and historic deposits. As a result, prospectors gained the ability to test ideas before ever entering the field.
Modern Gold Maps as Learning Tools
Today, gold maps serve a broader purpose than simple navigation. Instead, they act as educational systems that teach how gold moves and concentrates. Consequently, users learn to recognize patterns rather than chase single locations.
Ultimately, the history of gold maps reflects a shift from guesswork to understanding. Therefore, modern prospectors who study these maps gain a measurable advantage. In summary, gold maps now explain not just where gold was found, but why it can still be found.
FAQ
What These Maps Do
They show where gold is known to occur and where conditions support mineralization. Therefore, they often include structure, terrain, and mining history.
Guarantees?
No. These are decision tools. However, they can improve your odds by helping you focus on the best ground and avoid wasted time.
For Beginners?
Start with one state. Next, learn the repeating patterns the layers reveal. Then, apply those patterns to other regions as your confidence grows.
Is it Working Right?
Too many layers can add noise. Therefore, the best layouts prioritize clarity and keep the focus on the layers that lead to decisions.
Do I Have Complete Access?
Your receipt includes a PDF with your link. In addition, you receive delivery via email. Consequently, you can open it on mobile, tablet, or desktop.
Start With State-by-State Exploration
Select your state, explore the data, and learn the patterns that produce real results. May your buckets be heavy with gold and your pockets stuffed with money.
Browse State Maps →Questions? Email: admin@aurummeum.com